Visual Thinking
| by Maria Ebner & Derek Bruff | Visual Thinking |
| Cite this guide: Ebner, M. & Bruff, D. (2010). Visual Thinking. Vanderbilt University Center for Teaching. Retrieved [todaysdate] from https://cft.vanderbilt.edu/guides-sub-pages/visual-thinking/. |
- Introduction
- Images as Metaphors
- Images as Stories
- Schematic Diagrams
- Data Visualization
- More Resources
- Notes from March 2010 Workshop
Introduction
Our brains are wired to rapidly make sense of and remember visual input. Visualizations in the form of diagrams, charts, drawings, pictures, and a variety of other ways can help students understand complex information. A well-designed visual image can yield a much more powerful and memorable learning experience than a mere verbal or textual description.
Below you’ll find resources for integrating visual thinking in your teaching. You’ll find ideas for enhancing your presentations and for incorporating visual thinking in your students’ in- and out-of-class activities.
On March 17, 2010, the CFT hosted a workshop on this topic. Here’s the Prezi that CFT staff Derek Bruff and Maria Ebner used to give participants in the workshop an overview of some visual thinking tools of potential use:
For more notes from the workshop, as well as ideas participants generated during the workshop, see the bottom of this page.
Images as Metaphors
- Presentation Zen: Garr Reynolds, author of Presentation Zen, maintains a blog in which he writes about effective presenting. The Presentation Zen approach involves more than just using images as metaphors, and Reynolds’ book and blog provide numerous examples of effective use of visuals in slideware presentations.
- Example: The presentation below on the authoring cycle was designed by Teaching & Learning doctoral student Emily Bigelow. She took a set of slides she had used in the past for this topic and gave them a “PowerPoint makeover” using the Presentation Zen approach. To see the original slides, see her guest post on the CFT blog.
View more presentations from erbigelow
- Example: See Derek’s “Lecturing Basics” presentation below. Note the use of bold, attractive images as metaphors as a way to communicate meaning and make ideas more memorable.
View more presentations from Derek Bruff.
- Example: The presentation below on the authoring cycle was designed by Teaching & Learning doctoral student Emily Bigelow. She took a set of slides she had used in the past for this topic and gave them a “PowerPoint makeover” using the Presentation Zen approach. To see the original slides, see her guest post on the CFT blog.
- VisualsSpeak: VisualsSpeak is a set of well-chosen photographs useful for facilitating sessions in which participants select images that help them answer questions and share ideas. The CFT has two sets of VisualsSpeak photo cards available for instructors to check out. Call the CFT at 322-7290 if you’re interested in borrowing a set.
- Example: Kate O’Doherty, graduate students in psychology and human development and 2010-2011 CFT Teaching Affiliate, wrote about her use of VisualsSpeak in an educational psychology class she taught in the spring of 2010.
- Graphic Facilitation: March 2010 workshop guest Peter Durand practices graphic facilitation, an approach to leading brainstorming and learning sessions in which visual thinking plays a key role. For more on graphic facilitation, which often uses images as metaphors but involves much more than that, visit Peter’s Center for Graphic Facilitation blog or this description of services provided by Alphachimp Studios, a group of graphic facilitators co-founded by Peter.
- Examples: Here’s an example of Peter Durand’s work. For more examples, see these visual notes from the CFT’s 25th anniversary symposium on the future of teaching, as well as Peter’s notes from the March 2010 workshop at the bottom of this page.

- Examples: Here’s an example of Peter Durand’s work. For more examples, see these visual notes from the CFT’s 25th anniversary symposium on the future of teaching, as well as Peter’s notes from the March 2010 workshop at the bottom of this page.

- Flickr: A great source for free, high-quality images is Flickr, the photo-sharing site. A lot of very talented amateur photographers post their work on Flickr. Some of these photos are copyrighted, making it difficult to use them in educational contexts. However, a lot of them are licensed under Creative Commons licenses, which means they can more easily be re-used. To locate good images on Flickr, try the search tool Compfight.
- Example: For examples of the kinds of photos you can find on Flickr, see these images found by Teaching and Learning doctoral students during an April 2011 workshop, and these images found by participants in a November 2011 conference workshop on visual thinking.
Images as Stories
- Digital Storytelling: See the University of Houston’s Educational Uses of Digital Storytelling site for an introduction to digital storytelling, examples of digital stories, and resources for getting started.
- Example: Five-Card Flickr is a storytelling exercise that involves selecting five Flickr images that tell a story. It’s based on the game Five-Card Nancy by comics expert Scott McCloud in which players make new stories out of individual panels of old Nancy comic strips.
- Example: “Digital Dossier” (embedded below) is a digital story told through a sequence of images accompanied by a soundtrack and voiceover. This type of digital story (one not involving actual video) is relatively easy to produce. See the University of Houston site for instructions. For more on “Digital Dossier,” see this Digital Natives blog post.
- Comics: Understanding Comics by Scott McCloud is an excellent introduction to and analysis of the visual language used in comics.
- Example: Dinosaur Comics is a comic strip that uses the same panels and images every day. The text, however, changes from day to day. In this blog post, Ryan North, creator of Dinosaur Comics, describes how a friend used Dinosaur Comics templates to teach English in Japan.
- Example: When Google introduced their Chrome Web browser in 2009, they had Scott McCloud create a 38-page comic book explaining how the new browser works.
- Example: Pixton is a free, online tool one can use to create comics. It allows you to create and alter images using a variety of drawing palettes, kind of like many video games allow users to create and alter their avatars.
- Visual Literacy: For an introduction to visual literacy in teaching and learning, read “Learning to Look,” by former CFT associate director Peter Felten and former CFT master teaching fellow Deandra Little. Click on the links to the right of the article for additional resources by Peter and Deandra.
- Example: Peter contributed to the Journal of American History article “Ways of Seeing: Evidence and Learning in the History Classroom.” The article features essays by five historians describing ways they have included visual literacy in their courses, including a contribution by Tracy Weis of Millersville University, whose student slide was shared in the workshop.
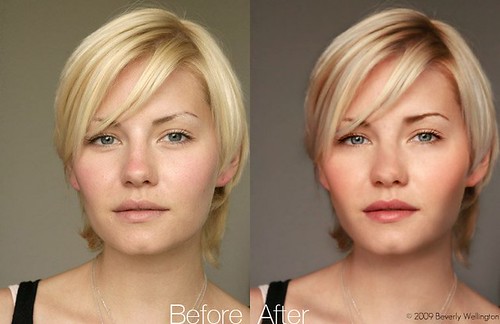
- Example: The “Before & After” photo seen below illustrates some of what can be done to alter images using tools like Photoshop. (Image by Flickr user beverlyislike, Creative Commons licensed.)
Schematic Diagrams
- Timelines: In a timeline, chronological information is represented spatially. Sometimes that representation is to scale (so that a greater spatial distance between two timeline events means a greater chronological distance between those events), sometimes not.
- Example: Jason B. Jones, who teaches English at Central Connecticut State University, has his students collaboratively construct a Victorian Age timeline. Here’s a description of this assignment and a tutorial for putting together your own collaboratively built timelines.
- Example: xkcd, a “webcomic of romance, sarscasm, math, and language,” has featured movie narrative charts that show how characters in a few movies interact with each other over time.
- Prezi: Prezi calls itself the “zooming presentation editor.” It’s a presentation tool that functions something like an alternative to PowerPoint or Keynote. Where those tools are inherently linear in their organization and presentation of content, Prezi is distinctly nonlinear. The tool makes it easy to arrange one’s content (text, images, YouTube videos, and so on) all over a large blank canvas. This makes it easier to leverage visual thinking in the design and sharing of one’s presentation. The tool can be used to present content fairly linearly (using some nice built-in transition effects) or nonlinearly, allowing one to zoom around the canvas as appropriate during a presentation.
- Examples: Immediately below is a Prezi created by mathematics graduate student Hang Wang on the topic of fractals. See her guest blog post for another example, as well as her thoughts on using Prezi as a presentation tool in mathematics.
- See also the CFT-created Prezi embedded at the top of this page and check out the Prezi immediately below for some strategies for using it effectively in the classroom.
- The Back of the Napkin: This book by Dan Roam provides an introduction to solving problems visually. Roam provides useful frameworks for looking, seeing, imagining, and showing. His new book, Unfolding the Napkin, provides more exercises and activities for developing visual thinking skills.
- Example: Dan Roam takes his “Back of the Napkin” approach to explain the 2009-2010 health care reform debate.
View more presentations from Dan Roam.
- Example: For an example of one kind of visual thinking discussed in Roam’s book, see Greg Kulowiec’s post, “Triptico Plot-It x American Revolution,” in which the high school history teacher describes an activity where students plot events associated with the American Revolution on a coordinate plane.
- Example: Dan Roam takes his “Back of the Napkin” approach to explain the 2009-2010 health care reform debate.
- Scientific Inscriptions: Scientists use a variety of inscriptional practices, such as free body diagrams in physics and skeletal formulas in organic chemistry. While the visual language of such diagrams are often intuitive to experts in these fields, students frequently struggle to understand these diagrams.
- Example: VESTA (Visualization for Electronic and Structural Analysis) is a tool used by earth scientists to visualize and interact with the structure of various nanoscale objects. See the gallery for examples of what VESTA can do.
- Concept Maps: A simple yet very effective tool for presenting information visually can be found in the use of concept maps. The wealth of research into learning styles and brain research tells us that it is easier to make meaning of new information when it is represented visually. Concept maps have been used for quite some time in numerous disciplines. Joseph D. Novak of Cornell University is credited with having developed the idea of concept maps and has done extensive research on their use. He provides a concise explanation of concept maps, their nomenclature, use, and effectiveness in his article “The Theory Underlying Concept Maps and How to Construct Them”.You can also download their open source software at the Florida Institute for Human and Machine Cognition.
- Example: VUE is free, open-source software used to create concept maps.It has been developed by Tufts University and is available for download. The Visual Understanding Environment (VUE) “is focused on creating flexible tools for managing and integrating digital resources in support of teaching, learning and research. VUE provides a flexible visual environment for structuring, presenting, and sharing digital information.”
- Example: Debategraph is an online tool for collaboratively creating concept maps designed to help clarify debates. The interactive concept maps created by Debategraph show the relationships between arguments and evidence associated with debates and controversies. See how Christiane Amanpour uses Debategraph to add an interactive element to her CNN reporting.
- Example: Grant Casey’s Connectivism Blog explores possibilities for the use of concept maps and other online technologies to implement in his class. It is interesting to follow a group of educators experimenting with new concepts of knowledge and knowledge sharing.
Data Visualizations
- Persuasive Infographics: Charts and graphs are often used in presentations to persuade listeners. However, often presenters end up with what Edward Tufte calls “chartjunk,” charts full of unnecessary visual elements that distract from the “story” the chart is meant to convey.
- Example: Presentation Zen by Garr Reynolds provides great advice on creating simple, elegant charts and graphs that tell stories. For example, here’s a blog post by Reynolds showing the evolution of a chart from messy to elegant.
- Example: In his documentary An Inconvenient Truth, Al Gore uses a chart showing global CO2 concentrations over time to great effect. The sharp spike in CO2 levels in recent years is represented fairly dramatically in the chart. Al Gore stepping onto a scissor lift and rising through the air as the spike in the chart is revealed certainly didn’t hurt the dramatic effect!
- Complex Infographics: While some infographics are used to highlight a particular story the presenter wants to convey, others are used to find stories in multi-variate data sets. These complex infographics represent more than one variable visually, using spatial relationships, relative sizes, and different colors to do so.
- Example: Gapminder creates interactive infographics conveying many different kinds of data about the countries of the world. To see Gapminder in action, watch Gapminder director Hans Rosling’s TED talk below. You can also create your own Gapminder-style charts using Google Docs.
- Example: Vanderbilt Library’s Geographic Information Systems (GIS) coordinator, Lindsey Langsdon, is available to help faculty, staff, and students analyze and display geographic information. For examples of the kinds of informative maps that GIS can create, visit the Vanderbilt GIS map gallery.
- Books: Here are a couple of books to help you learn how to create complex infographics.
- Now You See It: Simple Visualization Techniques for Quantitative Analysis by Stephen Few is a great book which focuses on the tools and techniques of visual business intelligence. See also Few’s Perceptual Edge blog.
- Envisioning Information by Edward Tufte provides strategies for visually displaying high-dimensional data. Tufte is an “analytical design” guru who is also known for his critique of PowerPoint, “The Cognitive Style of PowerPoint.” Tufte’s Web site has further resources on visually presenting information.
More Resources
- People interested in visual thinking (in and outside of academia) frequently bookmark resources on Delicious using the “vizthink” tag. See resources tagged using the Twitter hashtag #vizthink.
- Visual Thinking Strategies is a research-based education nonprofit that provides a teaching methodology, a developmentally appropriate image curriculum, and a learner-centered professional development program. Its Web site is full of useful resources, and it regularly organizes online and face-to-face workshops and events.
- Visual Language for Designers: Principles for Creating Graphics that People Understand by Conny Malamed is a large book that begins with a section on how we process visual information and then introduces principles that help you understand how to organize for perception and simplify visuals.
Notes from March 2010 Workshop
During the workshop, graphic facilitator Peter Durand captured the presentation and discussion on a virtual white board. Click on the images below for larger versions.


At the end the workshop, participants were asked to identify visual tools discussed in the workshop they wanted to try out in their teaching. Participants shared their ideas in words and pictures. Below you’ll find a few examples. Click on an image to see a larger version.


This teaching guide is licensed under a Creative Commons Attribution-NonCommercial 4.0 International License.